
Multi-timeframe market study

KYRA Chart

Read structure without leaving your operating context.

Nine real product surfaces, organized around a disciplined chart-study loop: analyze structure, read participation, then practice without live execution.

Product screenshots · Markets and examples shown for illustration

One thesis from observation to review

KYRA Chart keeps the study, its participation evidence, and the rehearsal environment in one visual thread. The screenshots below show the product itself, not a decorative dashboard mockup.

Analyze

Build a readable market thesis before thinking about execution.

Start with the broad workspace, choose the representation that fits the question, then leave a clear record of what would invalidate the idea.
KYRA Chart market-profile workspace with candlesticks, session levels, and a distribution profile
One market-profile workspaceKeep price structure, session context, profile data, and the active study in one wide chart surface.
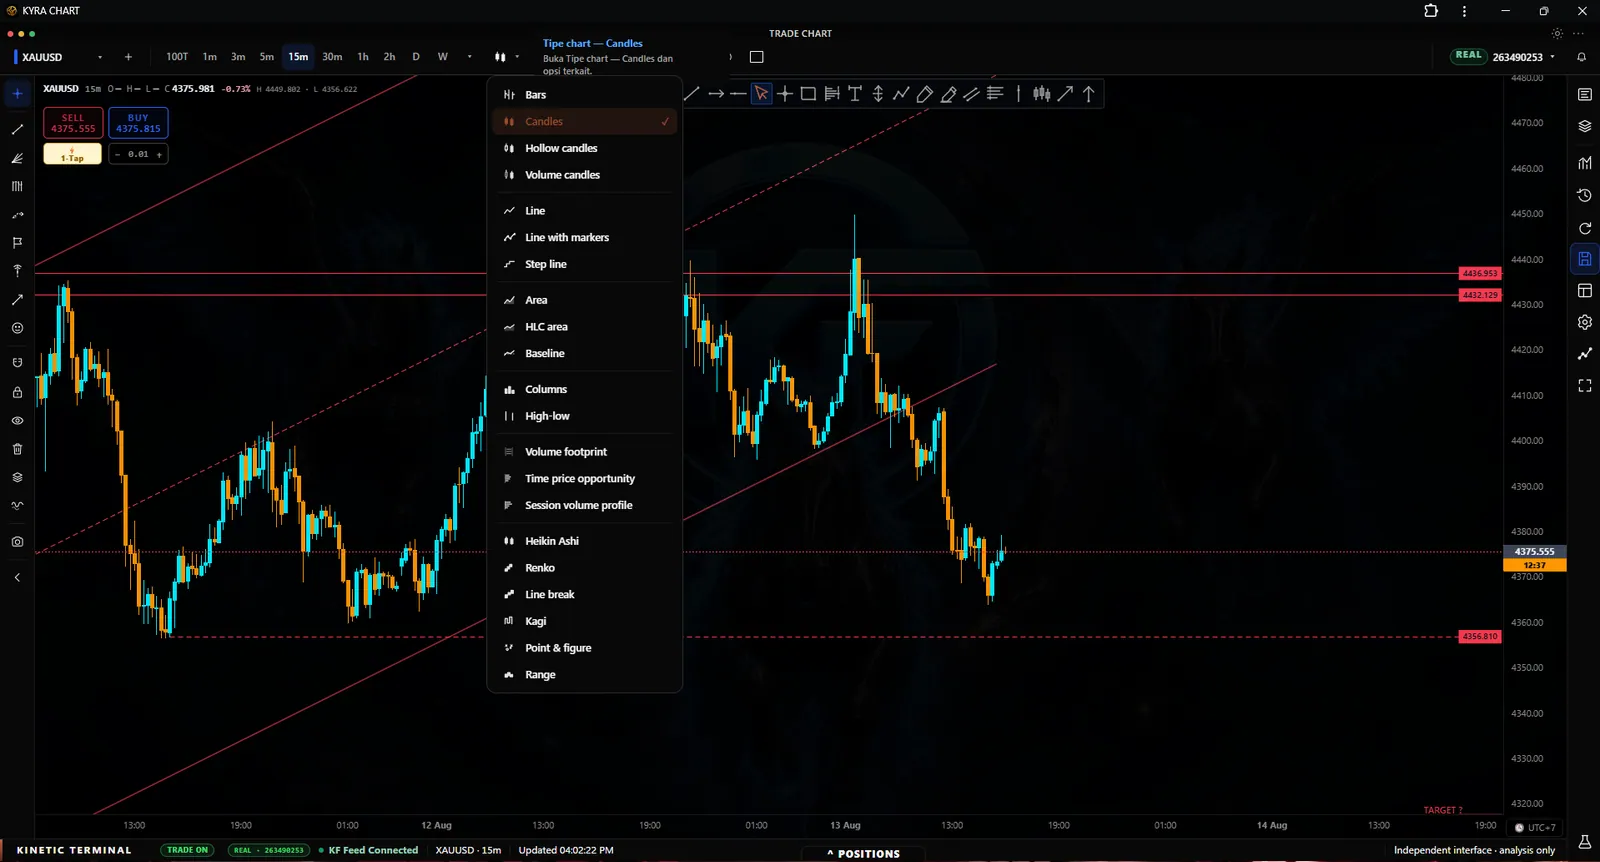
KYRA Chart type selector open above a live market chart
Change the chart, keep the contextCompare available chart types without rebuilding the instrument, timeframe, or surrounding analysis.
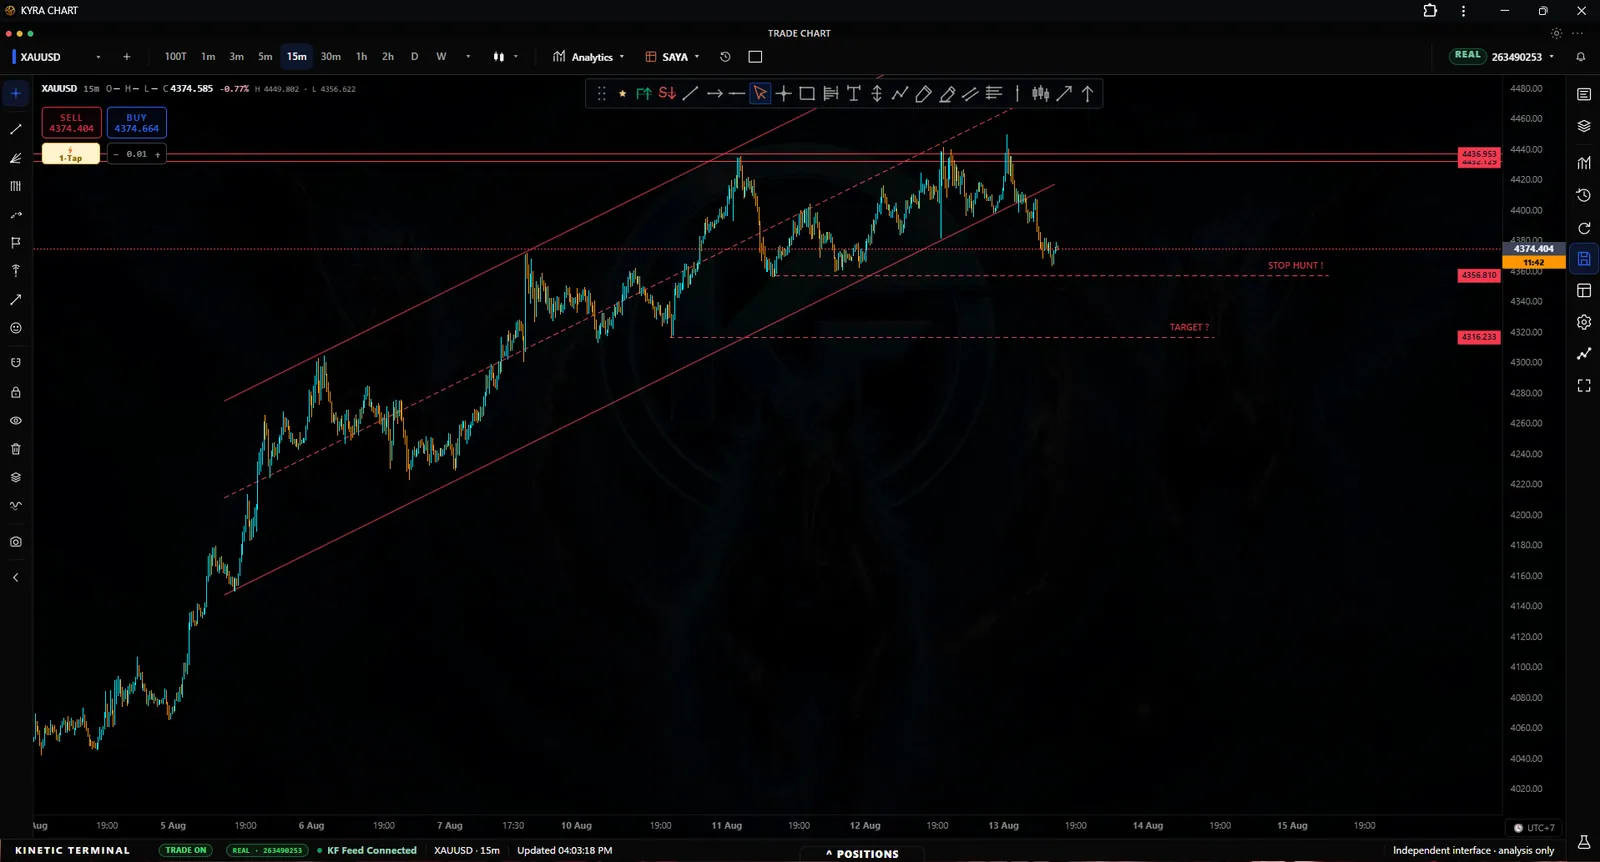
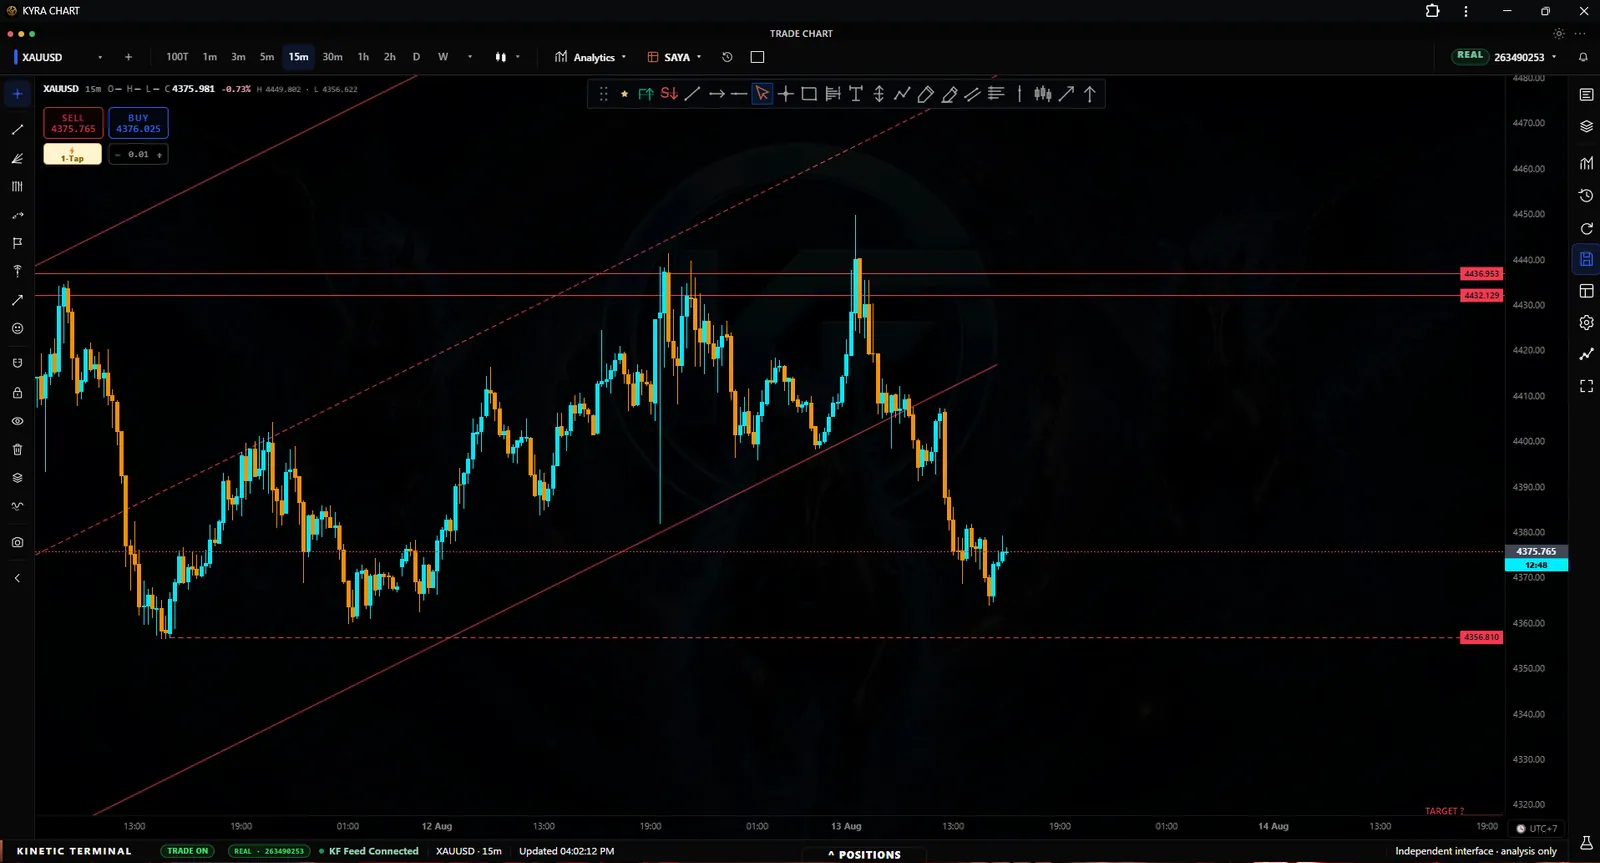
KYRA Chart annotation controls and marked price levels on a candlestick chart
Make the thesis visiblePlace text, shapes, levels, and decision notes directly beside the price action they explain.

Read participation

Look beyond direction to understand where the auction found agreement.

TPO, volume profile, and footprint views reveal different dimensions of participation. They are evidence to interpret, not automatic trade signals.
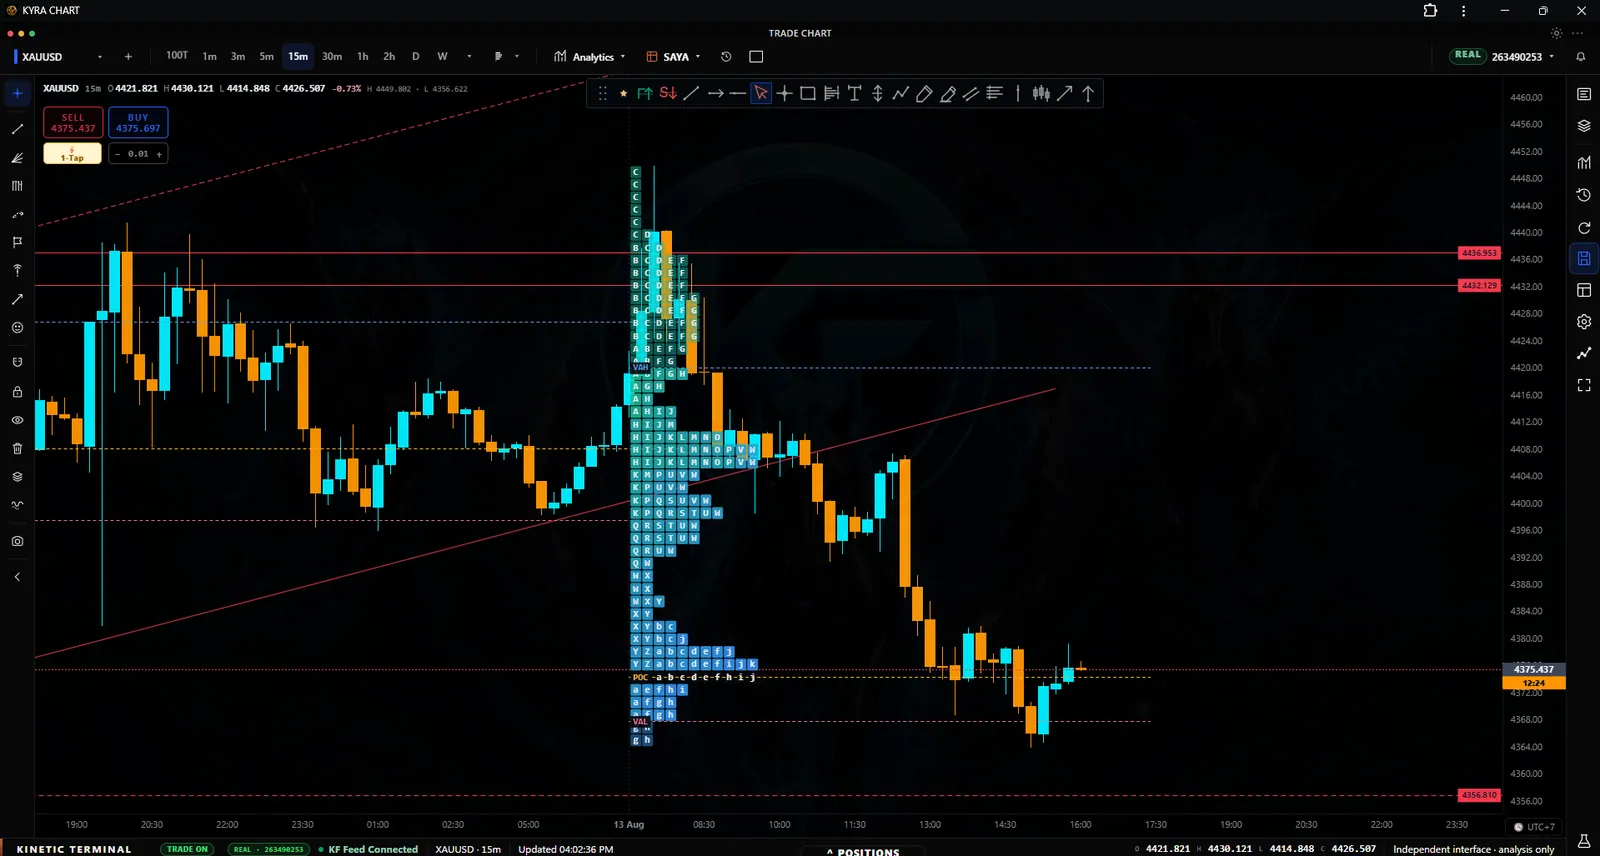
Time Price Opportunity profile beside a KYRA candlestick chart
Time Price OpportunityRead where the auction spent time and how each session developed around its value area.
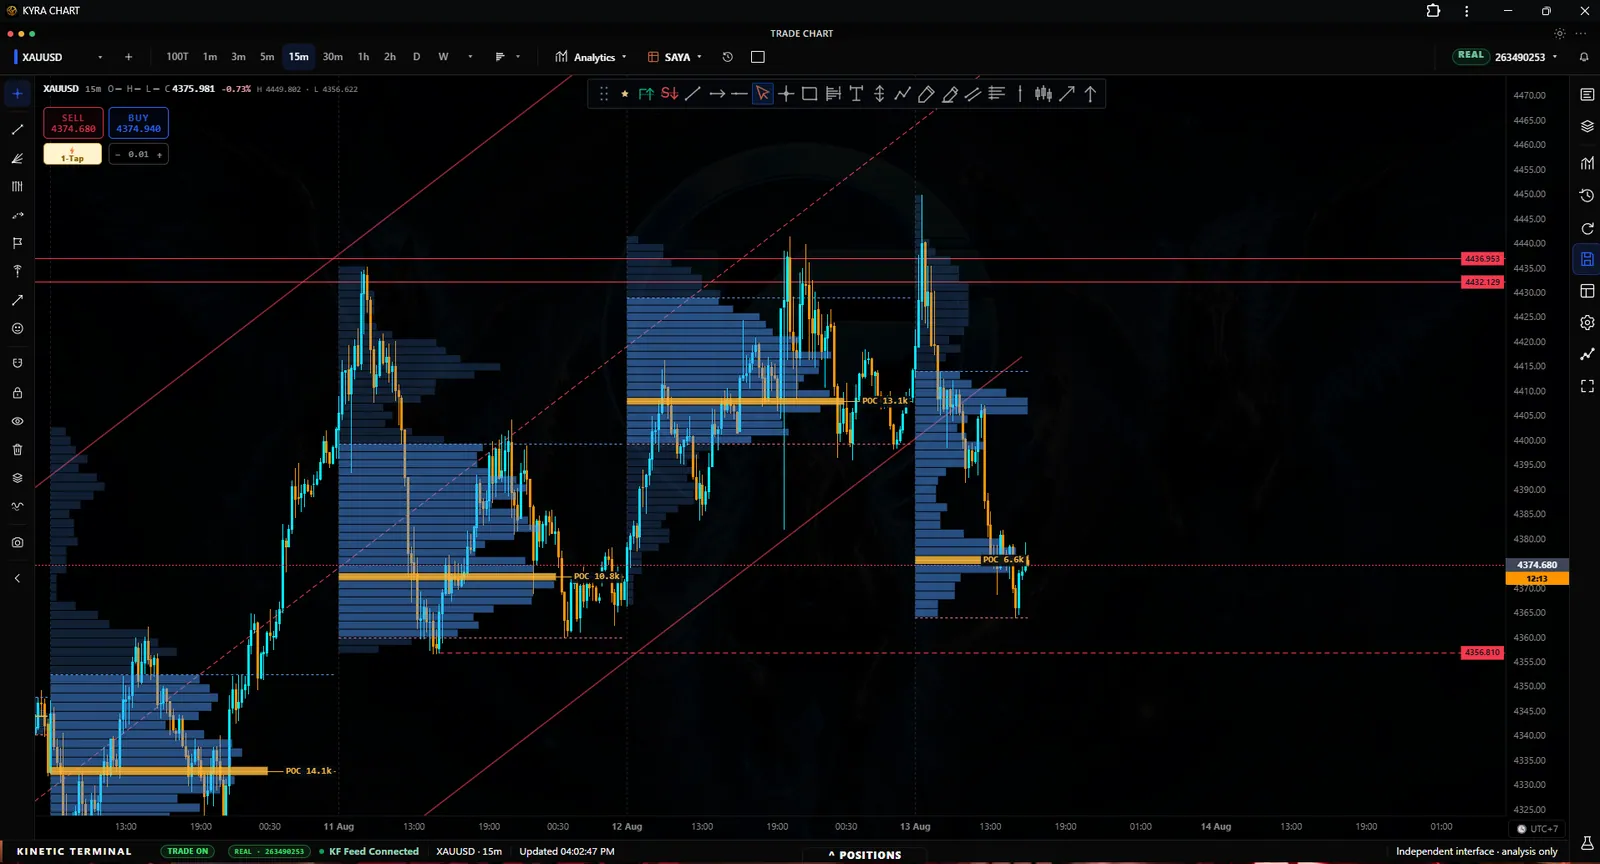
Volume profile histogram aligned to price on a KYRA market chart
Volume profileSee participation distributed by price so high-volume acceptance and thinner areas remain in view.
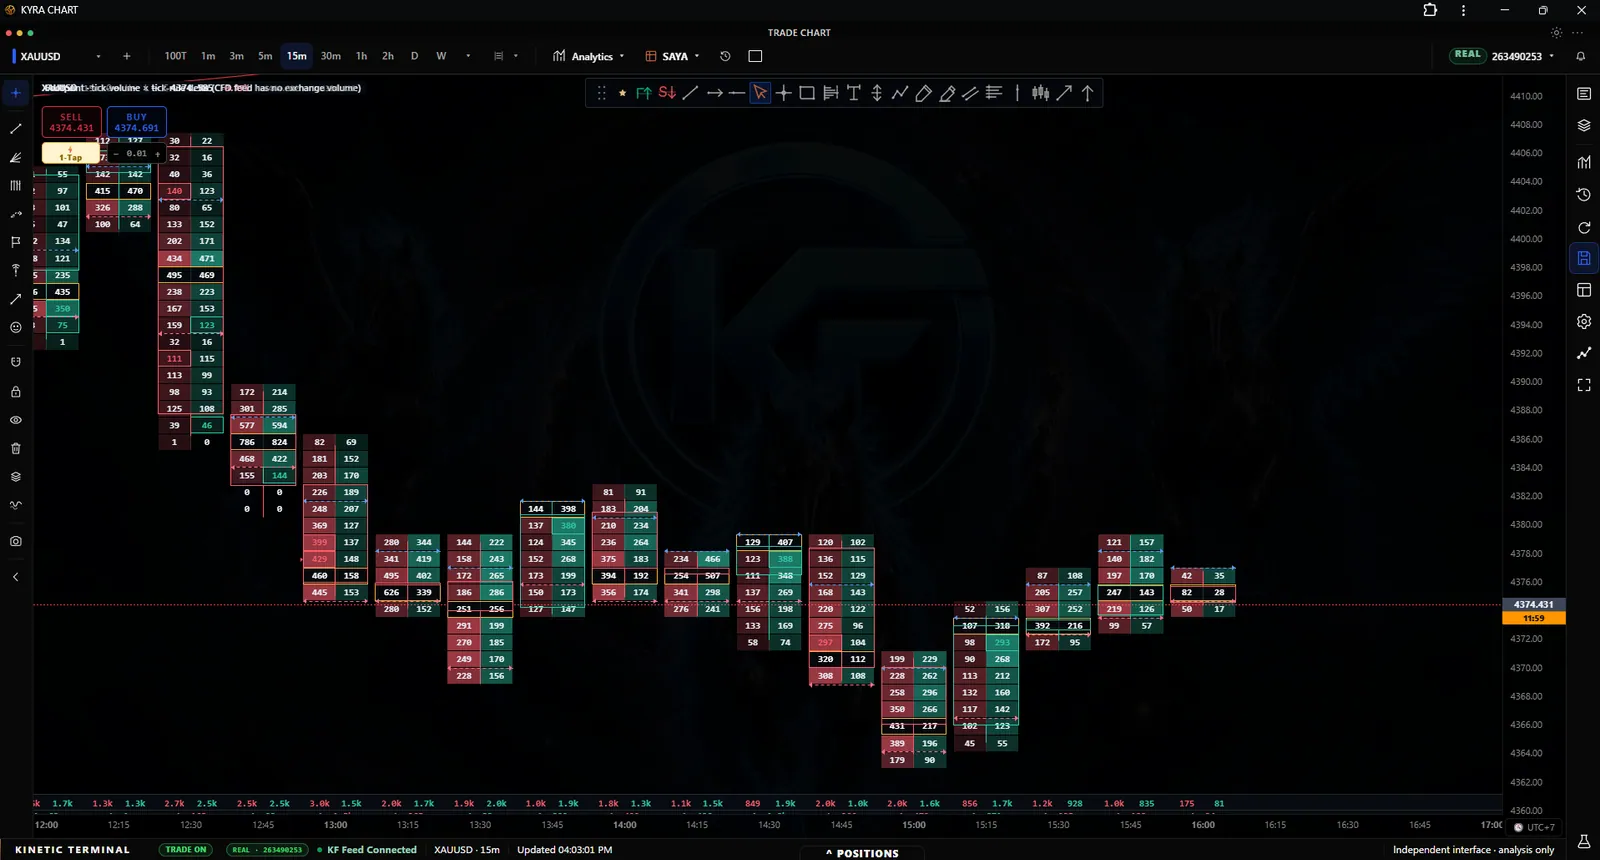
Volume footprint bars showing bid and ask participation inside KYRA Chart
Volume footprintInspect the buying and selling activity inside each bar when the surface-level candle is not enough.

Practice safely

Test the process at historical speed before placing capital at risk.

Replay and paper trading let you rehearse entries, sizing, and management while keeping the exercise separate from live execution.
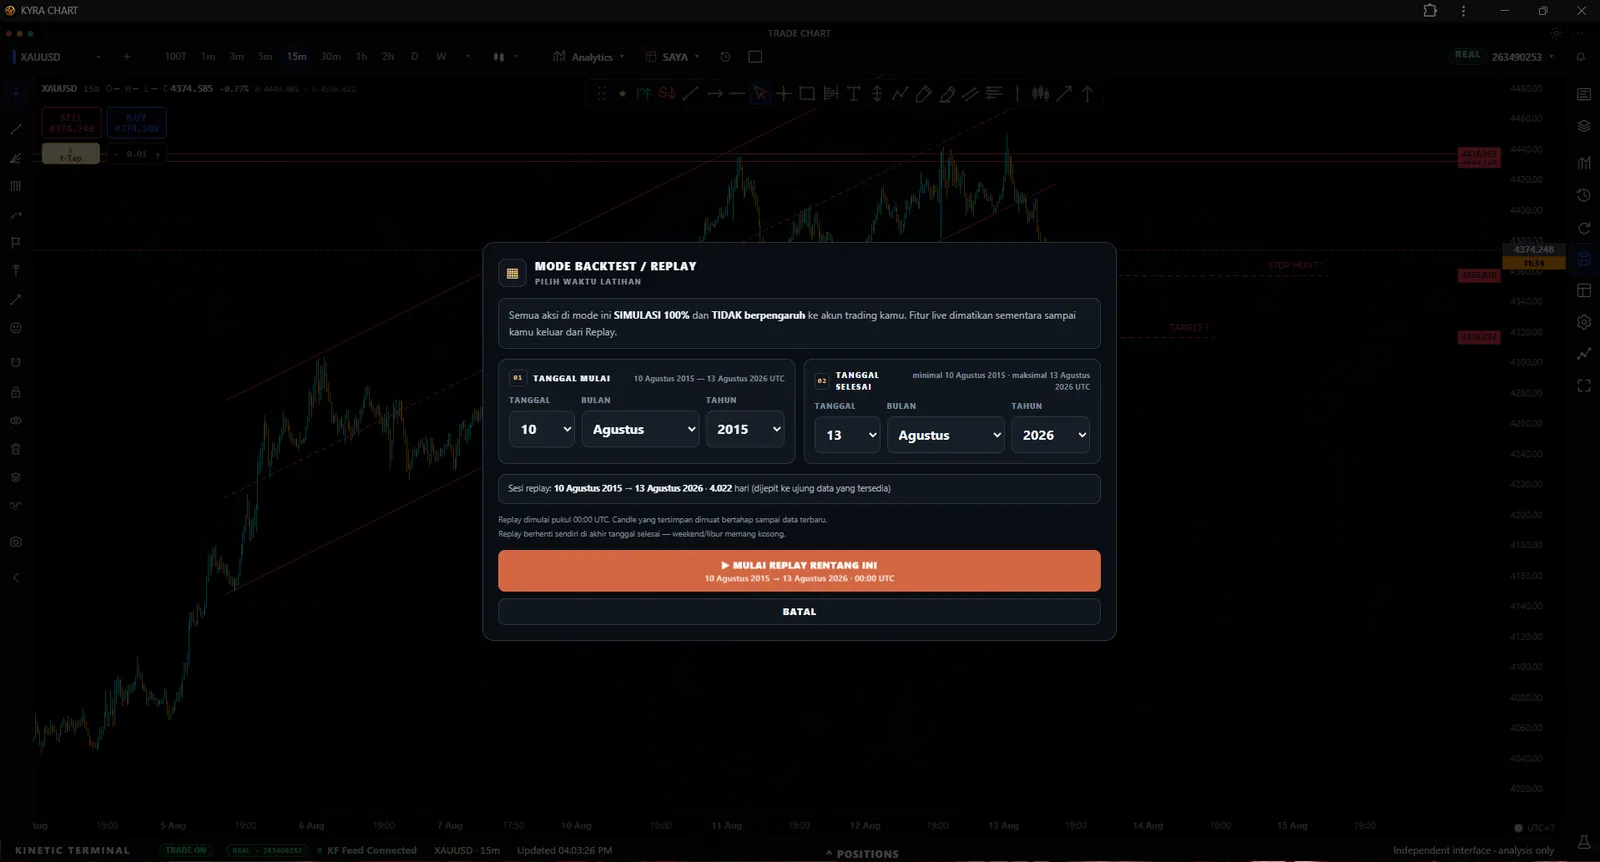
KYRA Chart replay setup dialog with date, time, and starting balance controls
Choose a replay starting pointReturn to a historical moment and define the starting balance before stepping through the session.
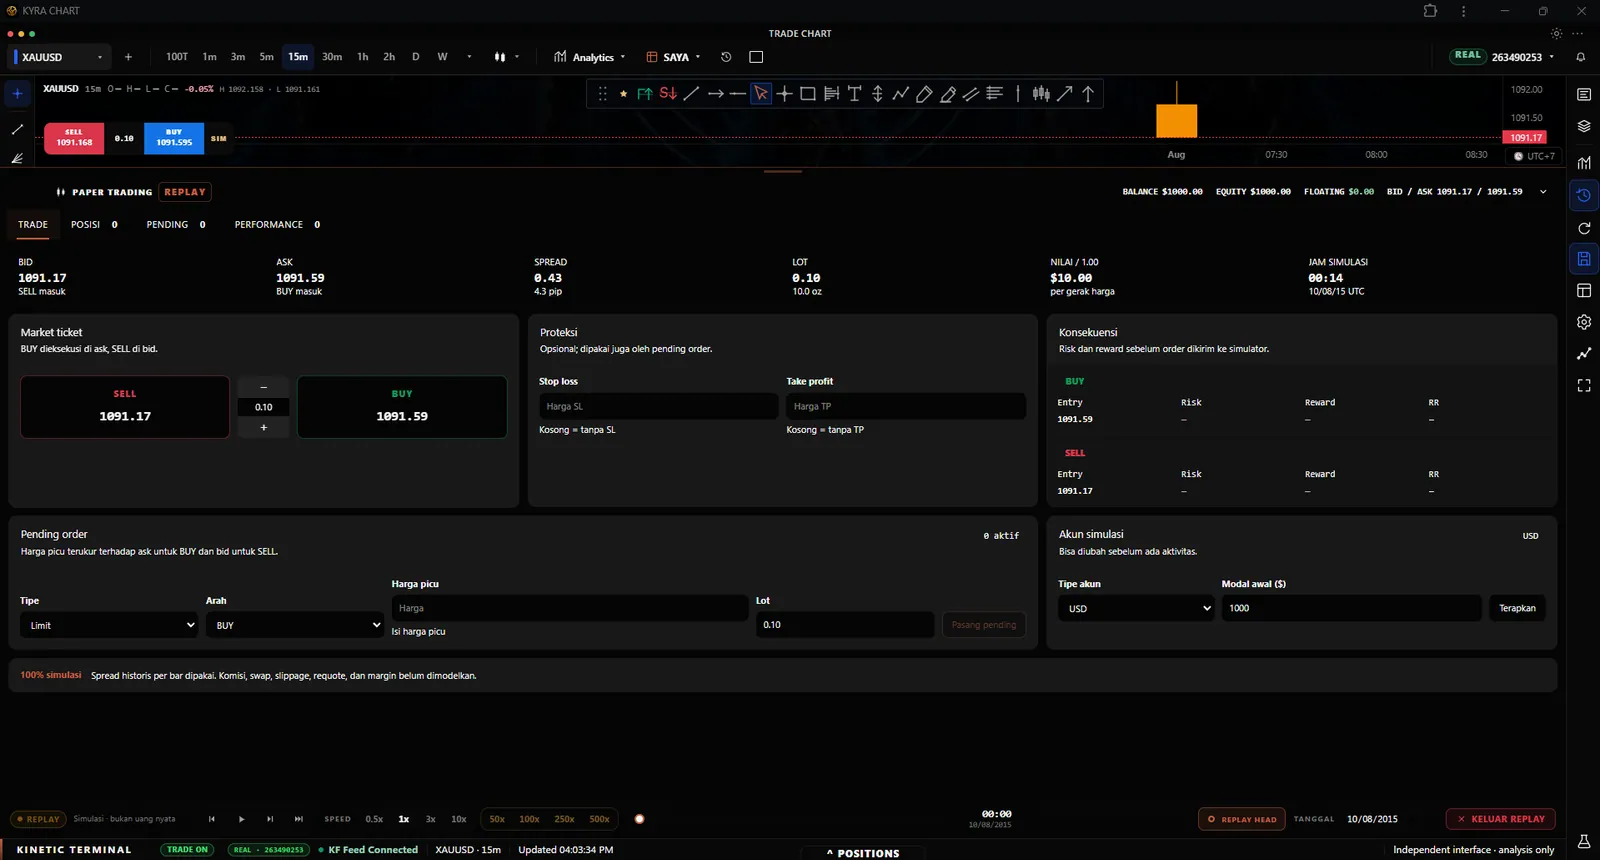
KYRA Chart paper-trading order ticket beside a historical chart
Rehearse the decisionUse the paper-trading ticket to practice entries, sizing, and exits without routing a live order.
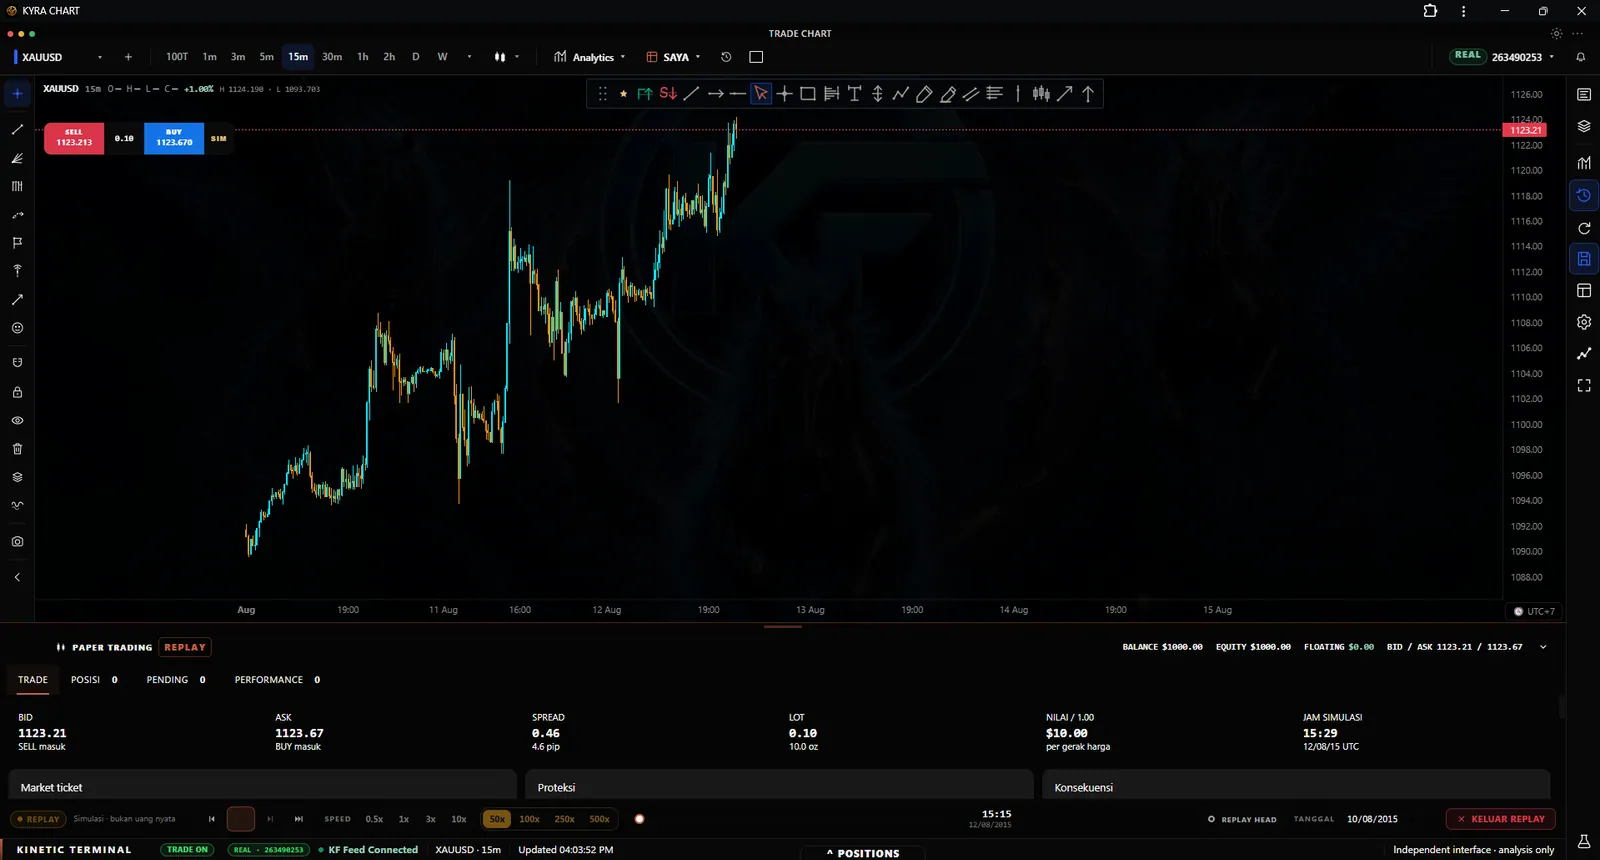
KYRA Chart replay in progress with playback controls and simulated position markers
Advance without hindsightMove the replay forward bar by bar and evaluate the plan using only the information available then.

Keep the evidence connected

Study the market. Rehearse the plan. Record what happened.

Explore the full system