

KYRA chart engine · Multi-timeframe market study
Kinetic Chart
Read structure without leaving your operating context.
Nine real product surfaces, organized around a disciplined chart-study loop: analyze structure, read participation, then practice without live execution.
Product screenshots · Markets and examples shown for illustrationOne thesis from observation to review
KYRA Chart keeps the study, its participation evidence, and the rehearsal environment in one visual thread. The screenshots below show the product itself, not a decorative dashboard mockup.
Analyze
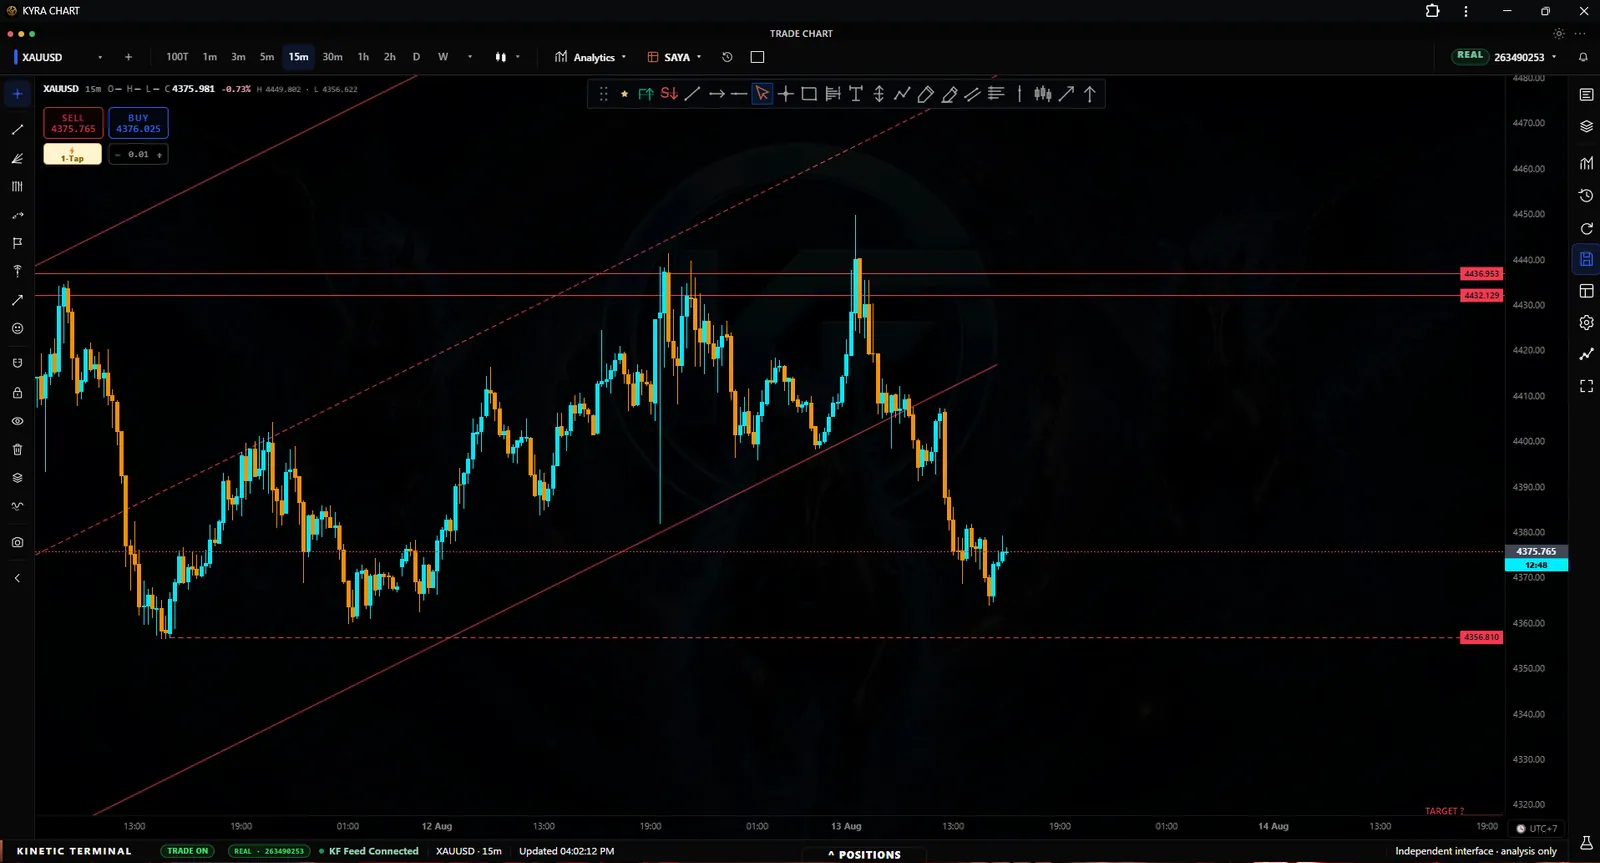
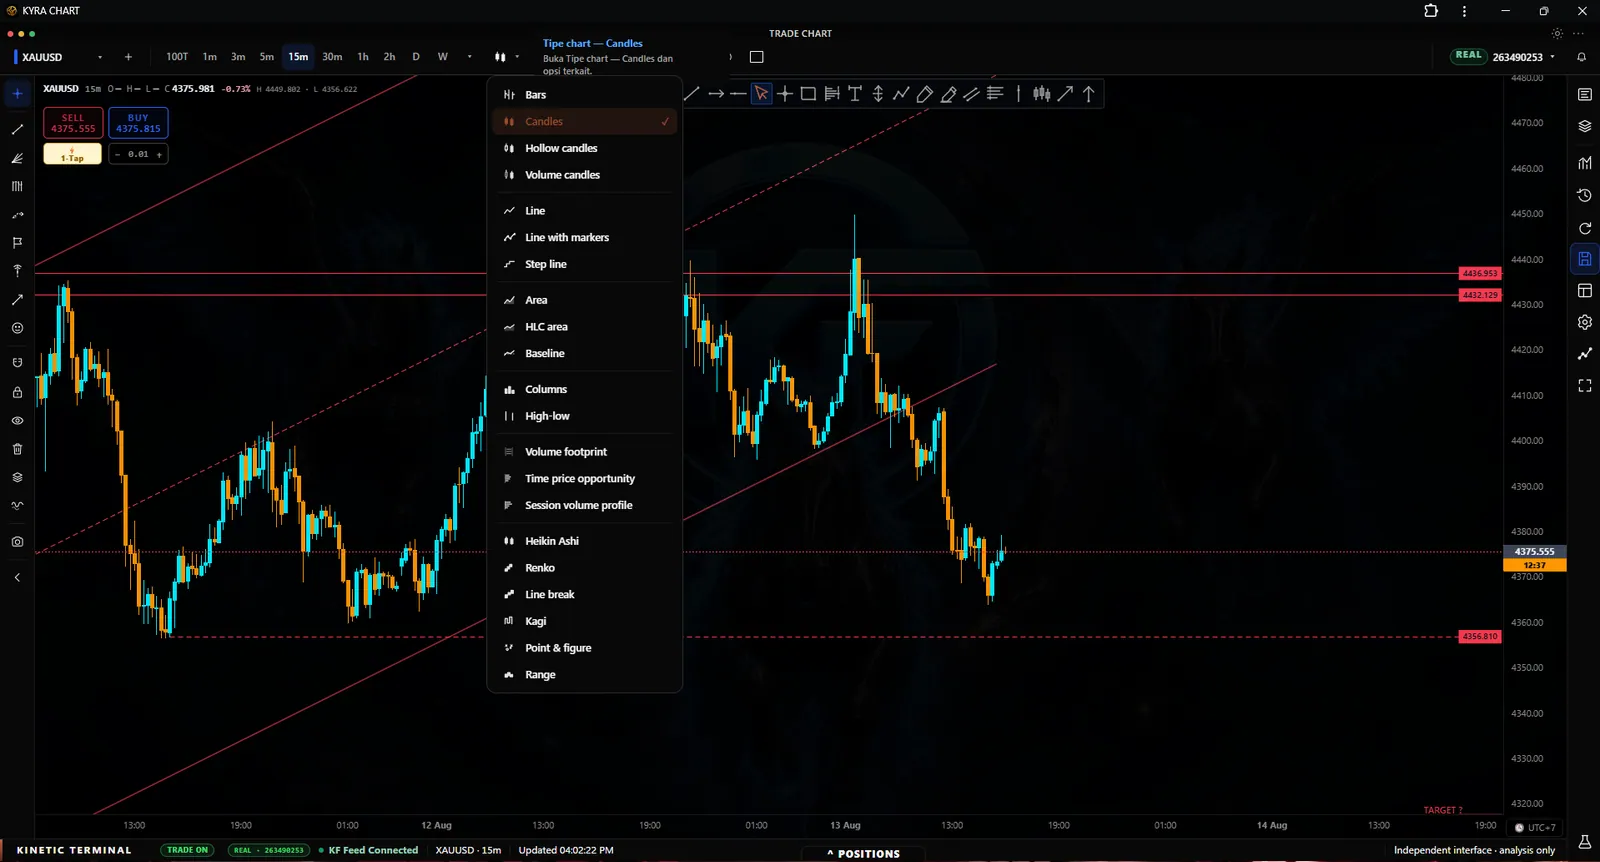
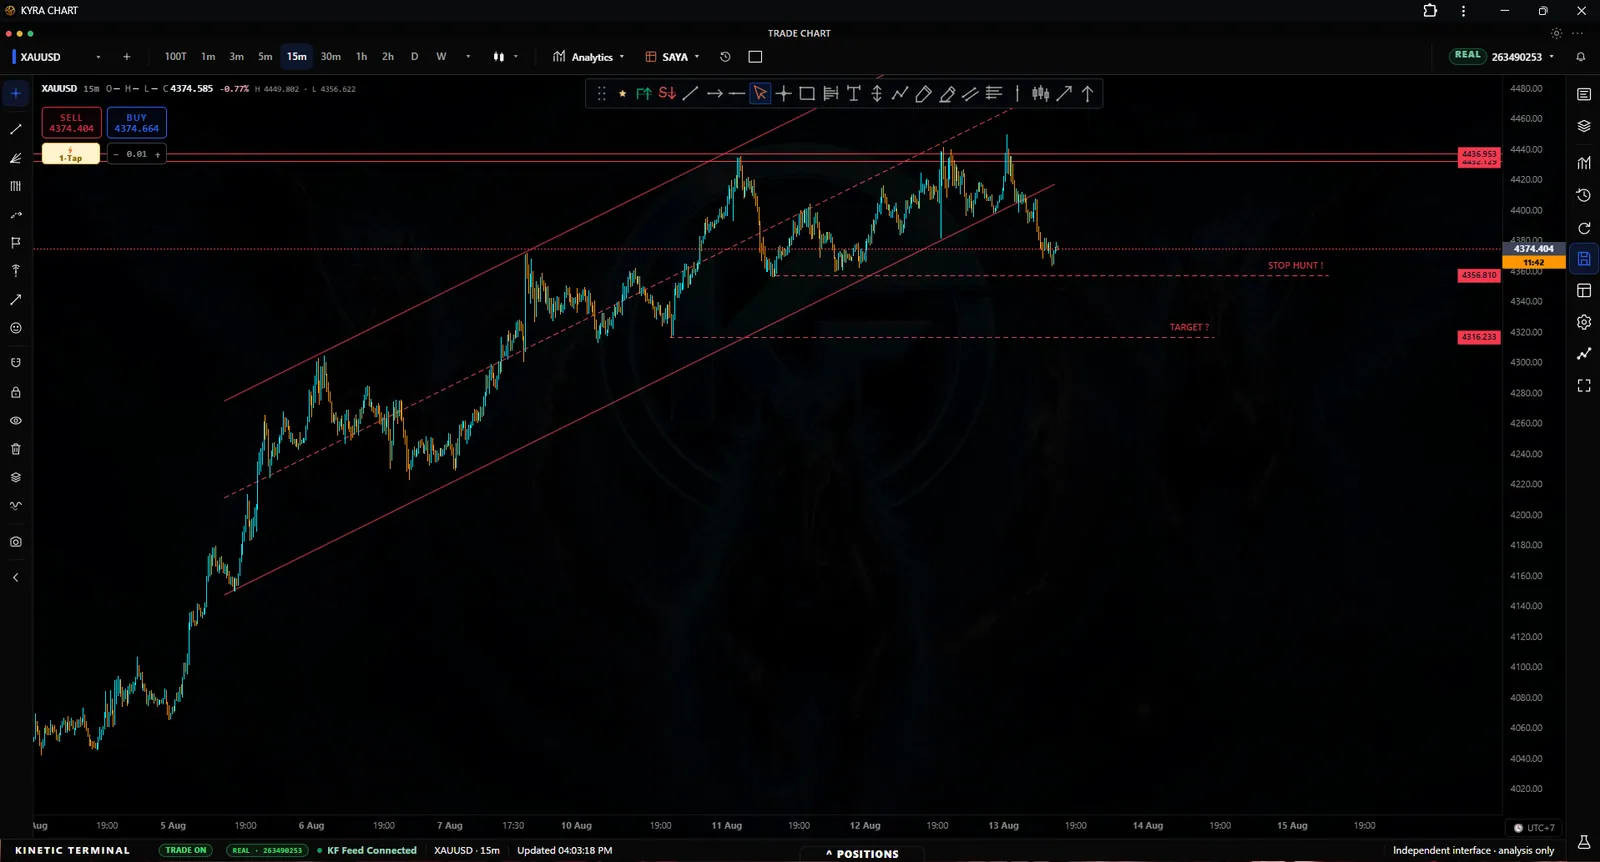
Build a readable market thesis before thinking about execution.
Start with the broad workspace, choose the representation that fits the question, then leave a clear record of what would invalidate the idea.
Read participation
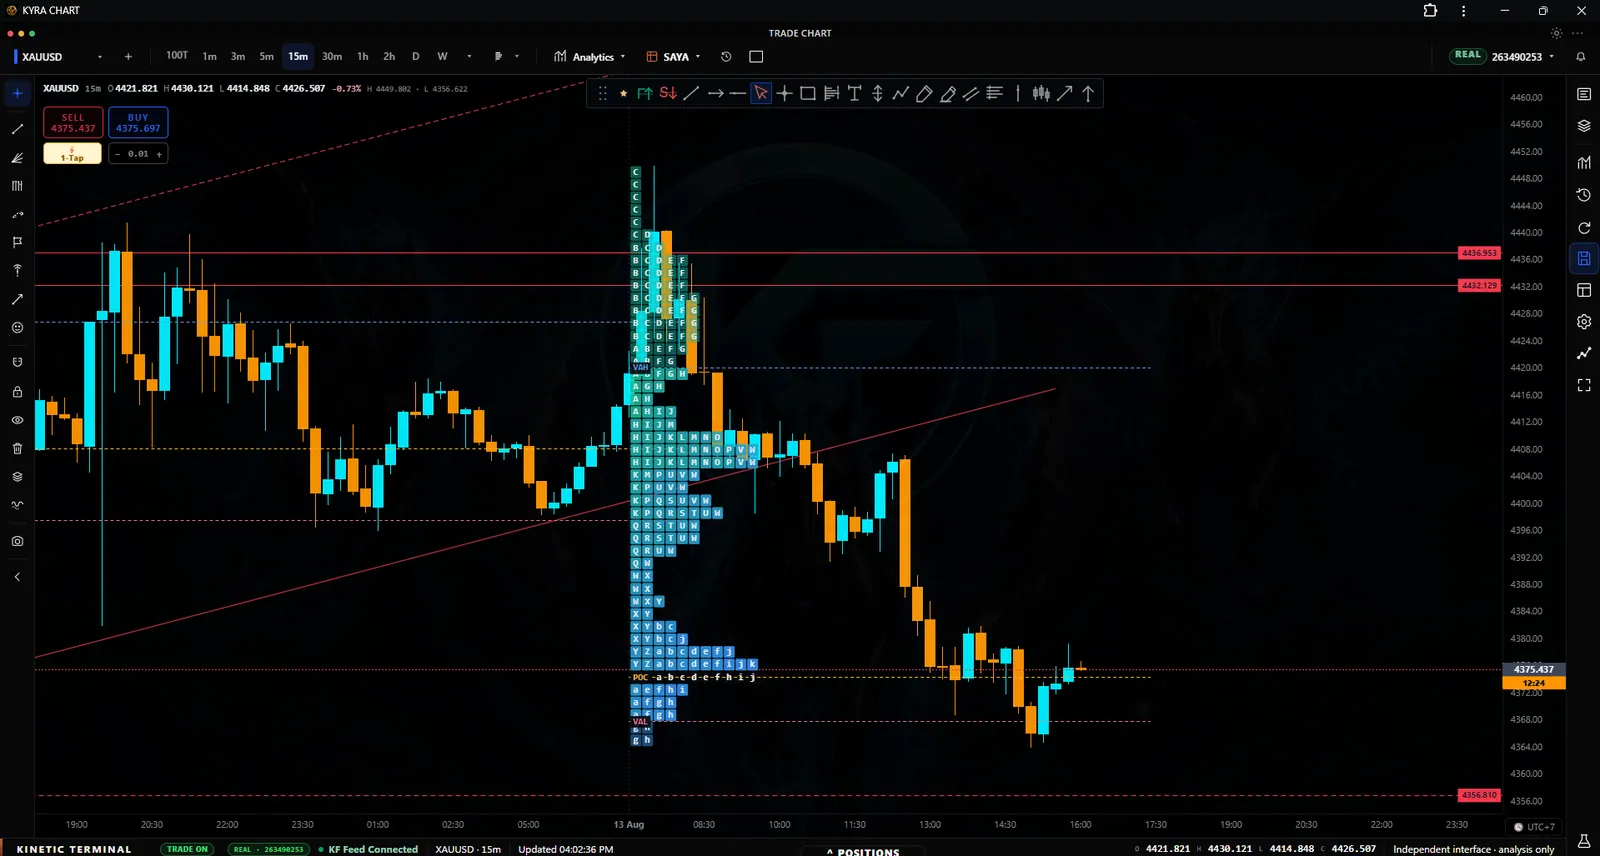
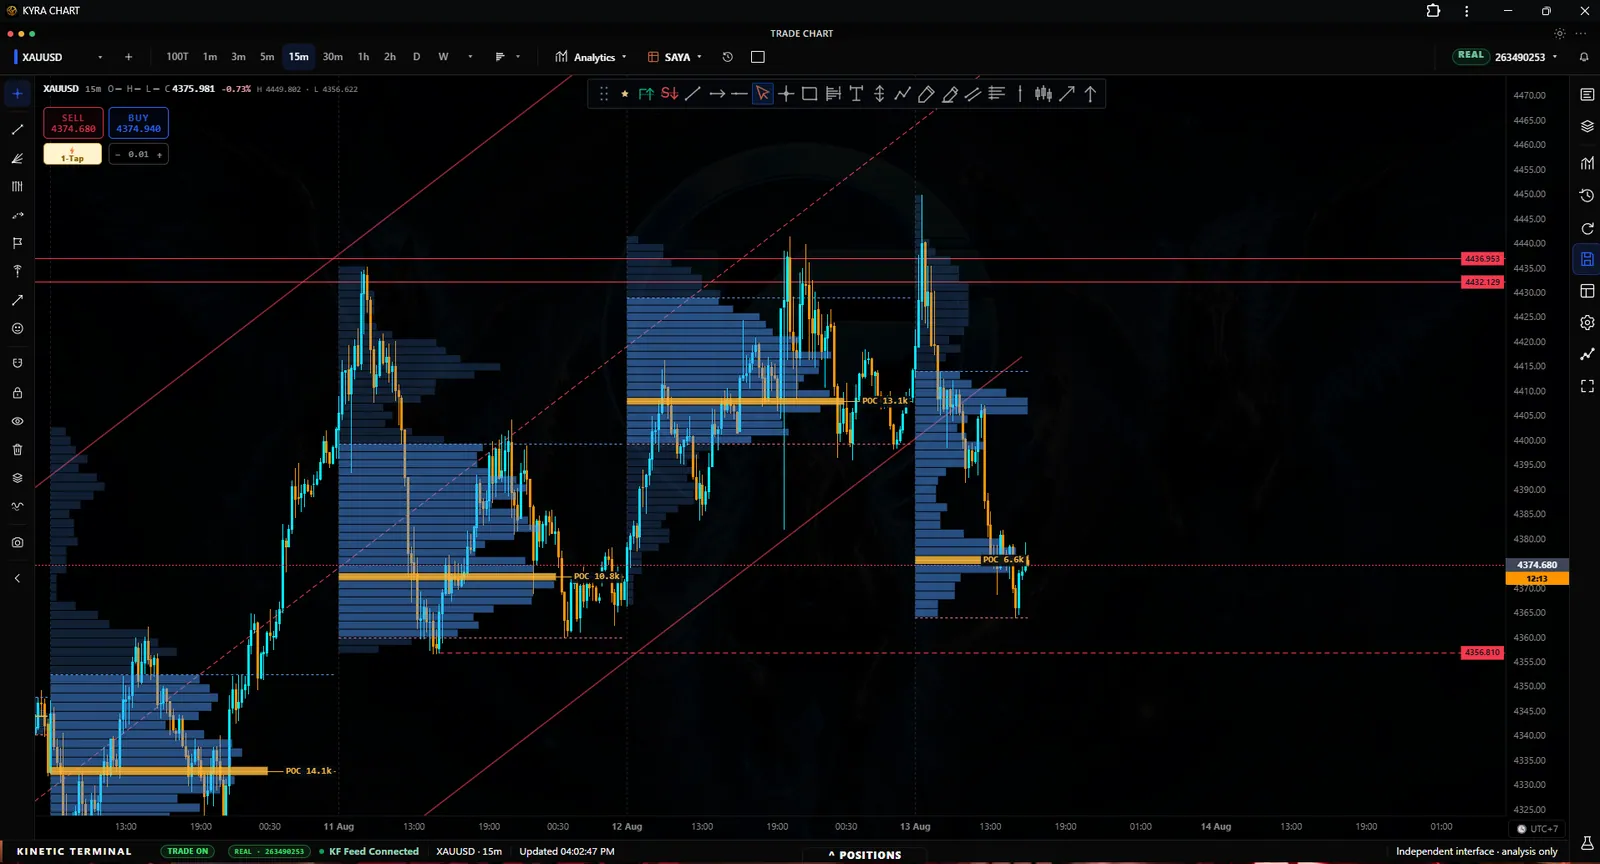
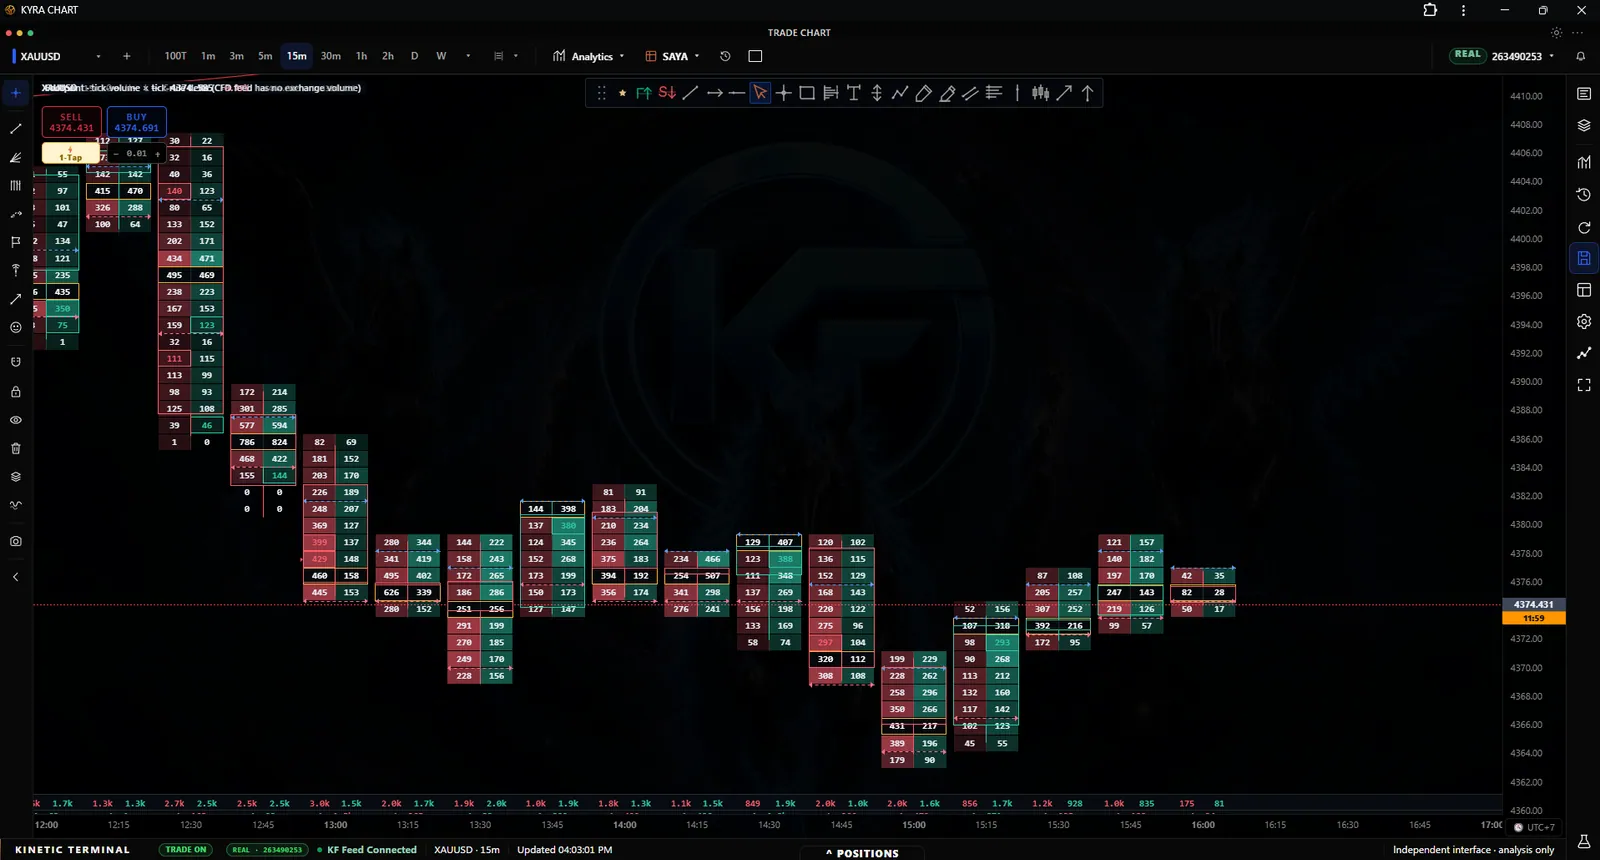
Look beyond direction to understand where the auction found agreement.
TPO, volume profile, and footprint views reveal different dimensions of participation. They are evidence to interpret, not automatic trade signals.
Practice safely
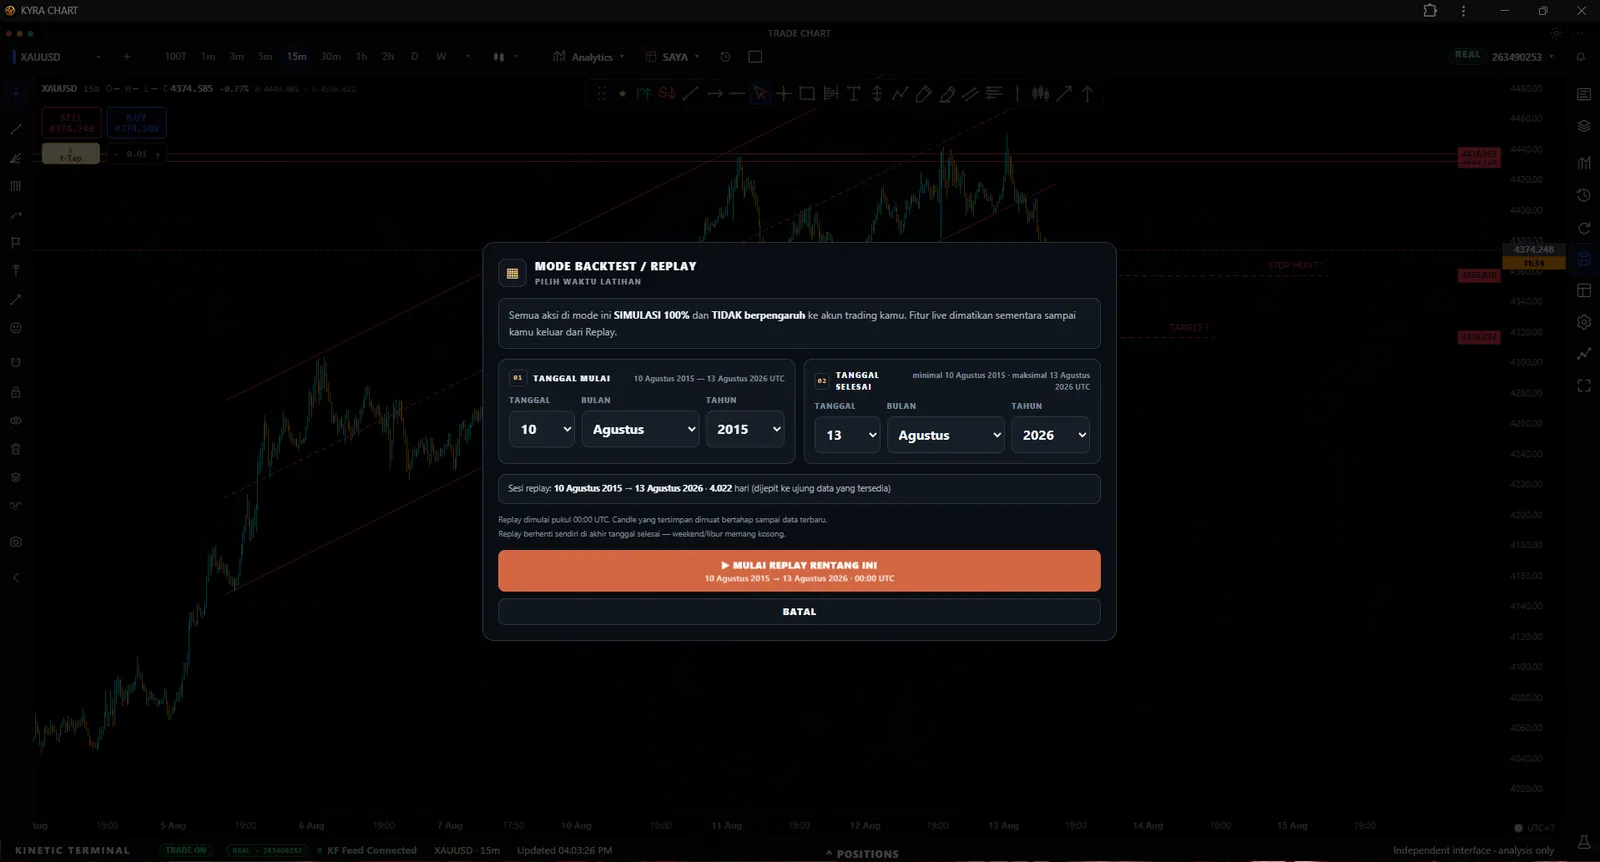
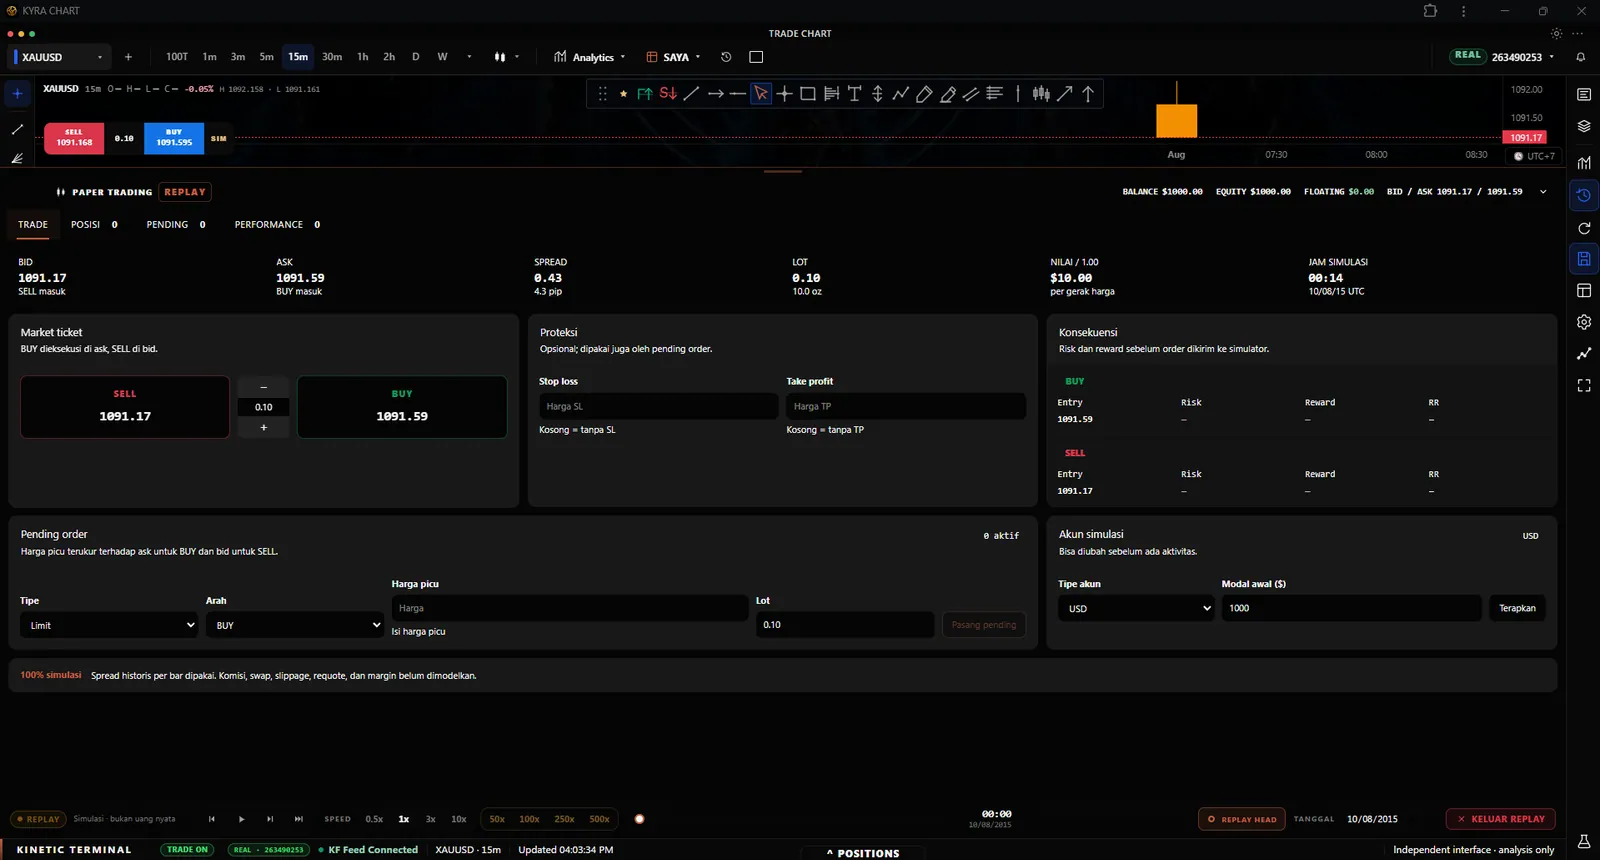
Test the process at historical speed before placing capital at risk.
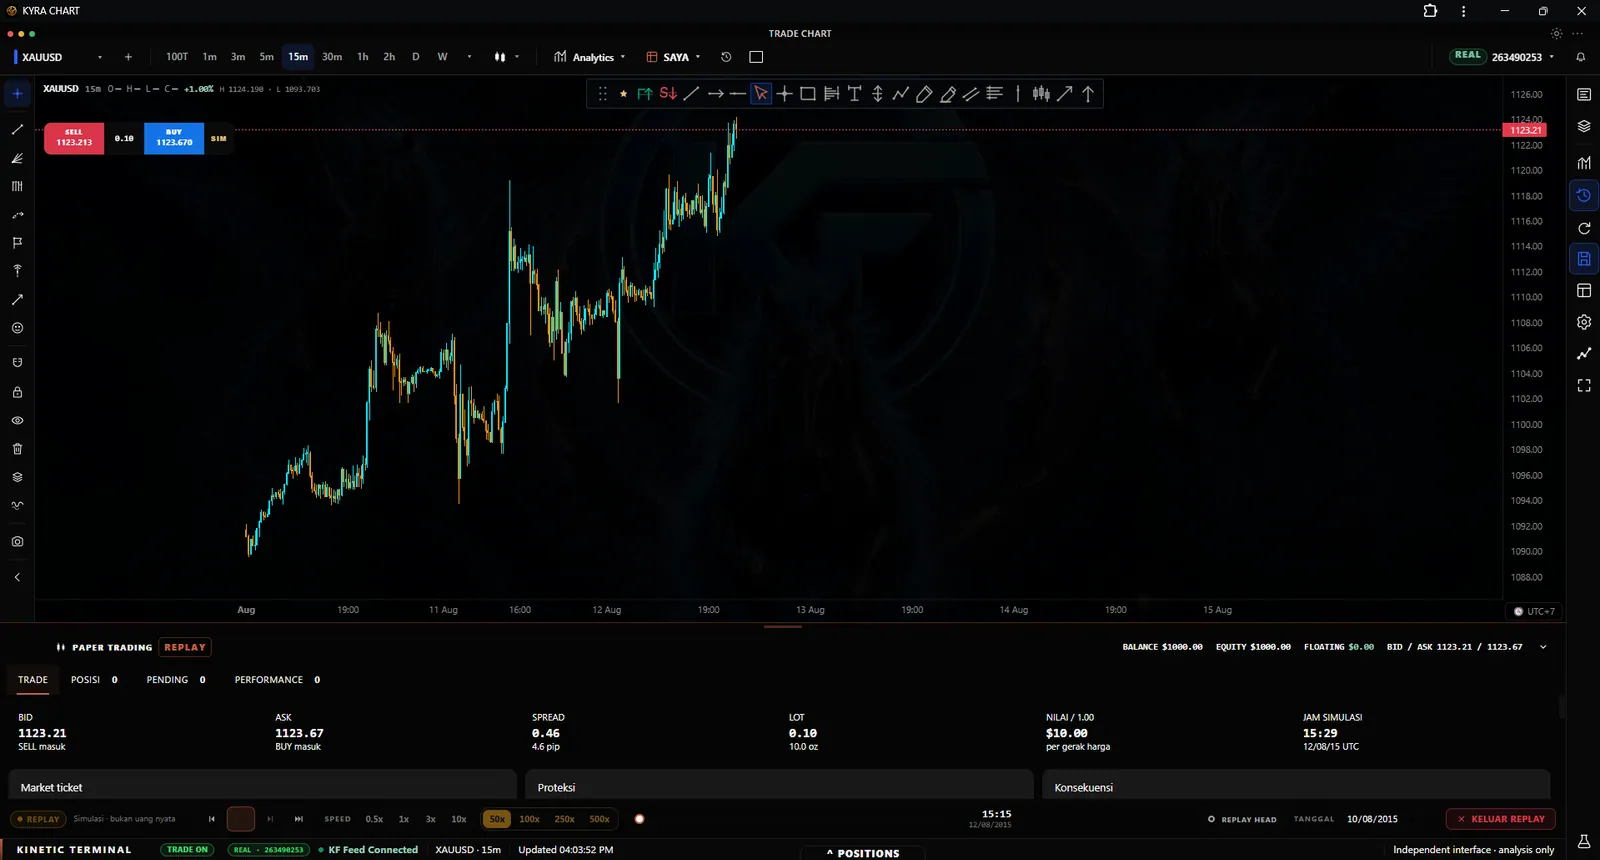
Replay and paper trading let you rehearse entries, sizing, and management while keeping the exercise separate from live execution.
Keep the evidence connected