

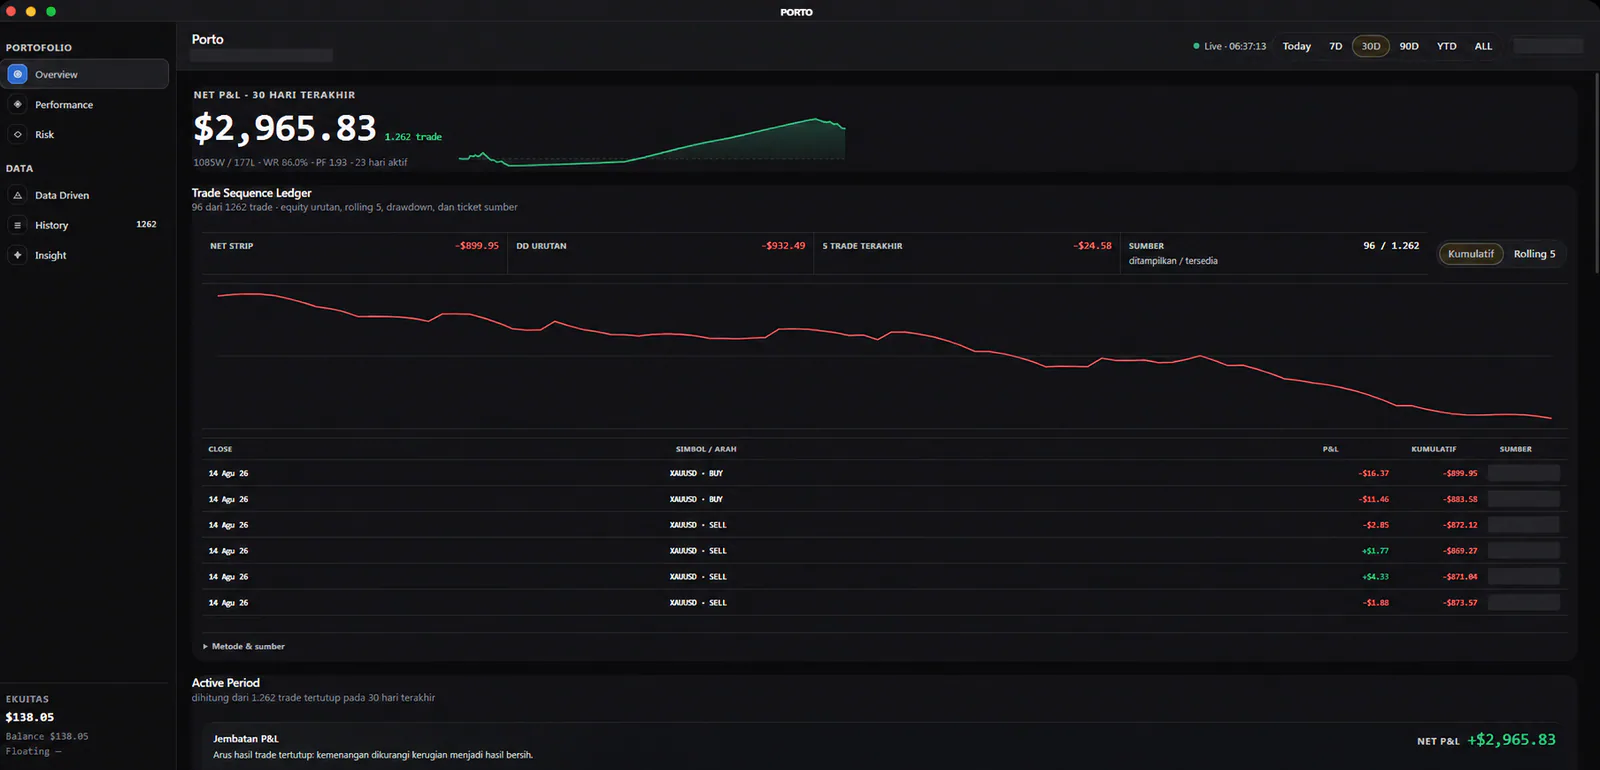
One connected review surface
From scattered accounts to one decision surface
Start with the outcome, then inspect its sequence, distribution, timing, and drawdown context before carrying a conclusion into the rest of your review process.
- 01Connect
Add account context through the integration workflow.
- 02Normalize
Align balances, symbols, sessions, and account labels.
- 03Understand
Move from total performance into the exact driver behind it.
- 04Review
Send meaningful moments directly into your journal loop.
Four analysis domains
Move from headline P&L to the conditions behind it.
Switch views to inspect the same selected period from performance, risk, attribution, and consistency perspectives.
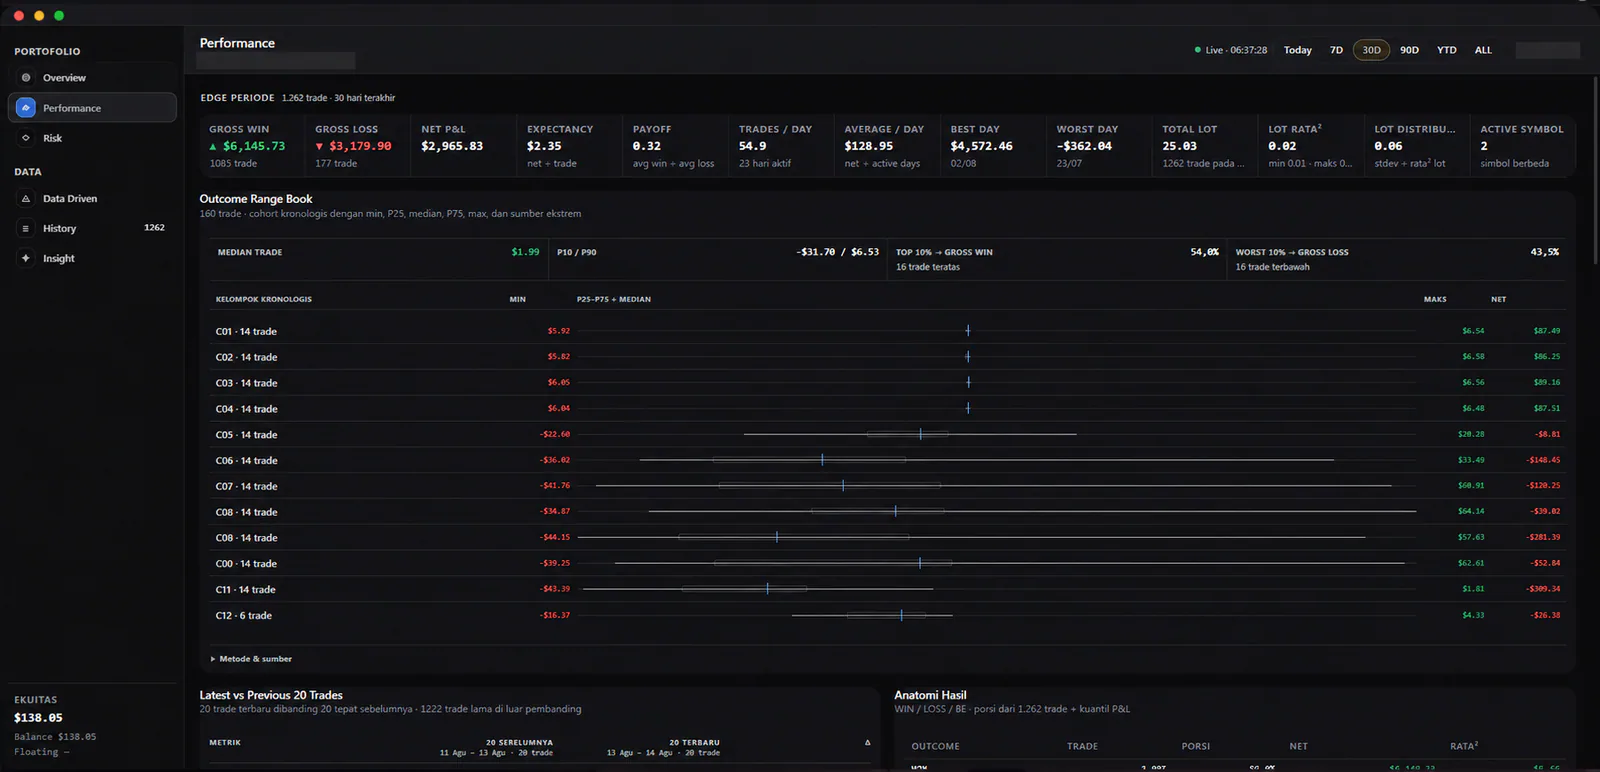
Performance clarity
Read the distribution, not only the total.
Move from headline P&L into gross outcomes, expectancy, payoff, and chronological cohorts so a result can be inspected in the context that produced it.
- Compare outcome ranges across chronological cohorts.
- Keep gross wins, gross losses, expectancy, and payoff in the same view.
- Review recent trades beside the preceding sample instead of in isolation.
Visual chapters
Each view answers a different review question.
The cards below keep the capability, explanation, evidence, and product-derived labels together for a first-time visitor.
Performance clarity
Read the distribution, not only the total.
Move from headline P&L into gross outcomes, expectancy, payoff, and chronological cohorts so a result can be inspected in the context that produced it.
Outcome rangesChronological cohortsRecent comparisonRisk context
Treat drawdown as an episode, not a single percentage.
Review depth, time underwater, losing sequences, recovery status, and gross-loss contribution together before deciding what a risk number actually means.
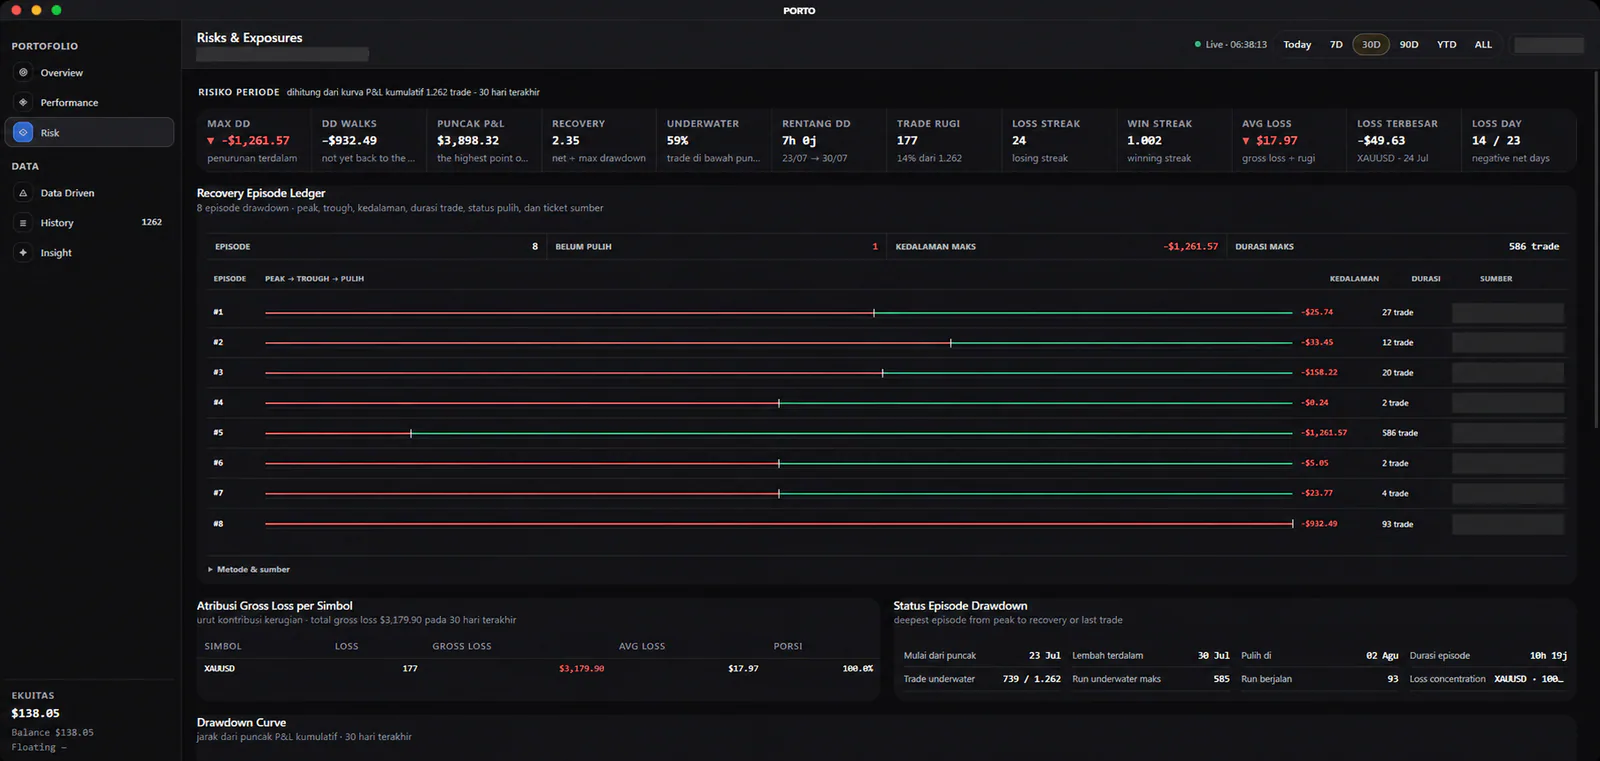 Drawdown depthRecovery episodesUnderwater duration
Edge & attribution
Trace the result back to symbols and changing cohorts.
Use contribution, distribution, rolling behavior, and period comparisons to find where performance came from without turning historical data into a forecast.
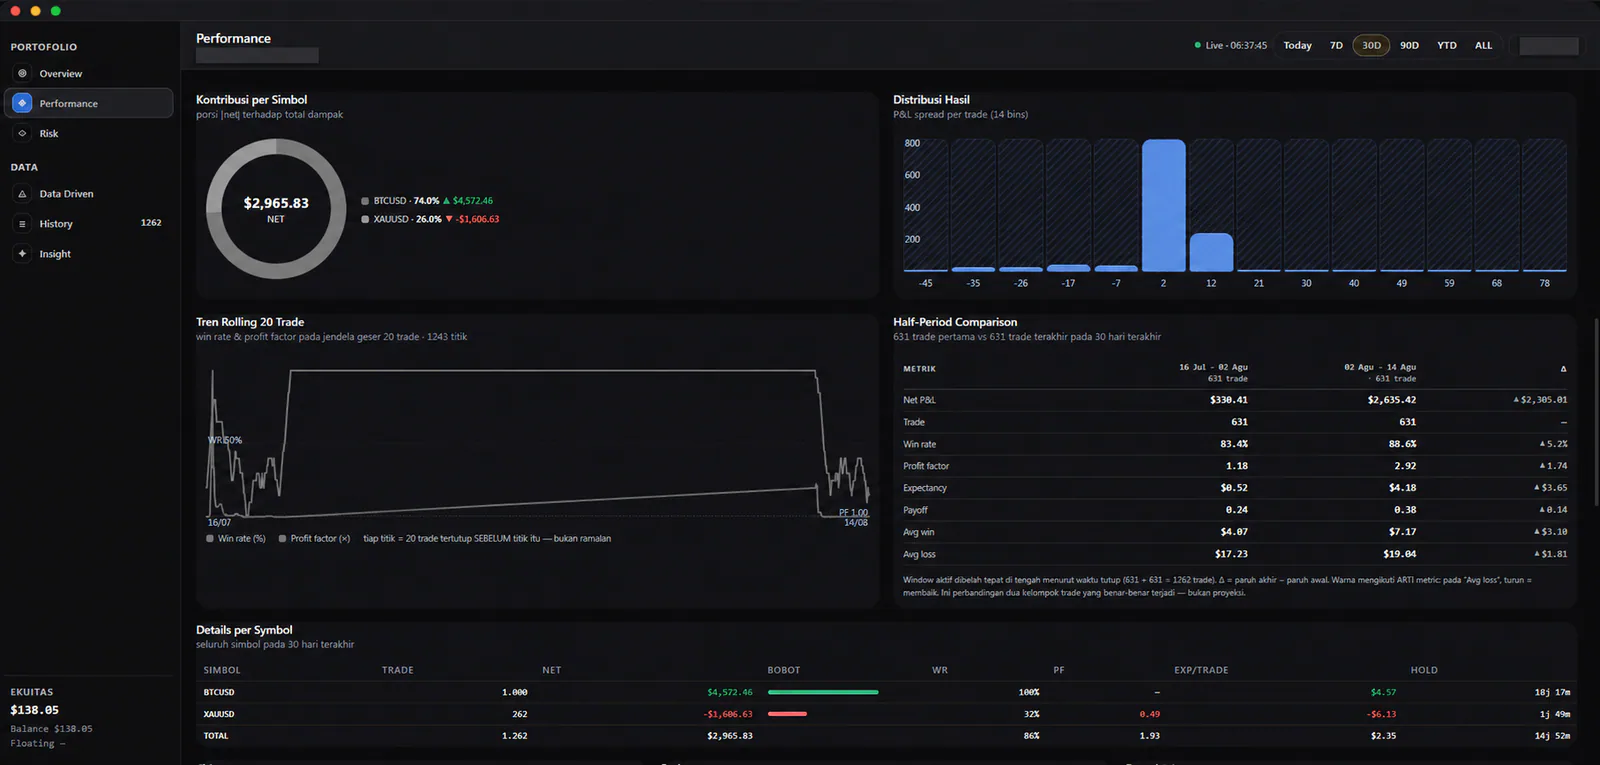 Symbol contributionP&L distributionPeriod comparison
Consistency
Find when the process holds up—and when it does not.
Map closed-trade outcomes by day, session, and opening hour so time-based patterns remain connected to trade count and net contribution.
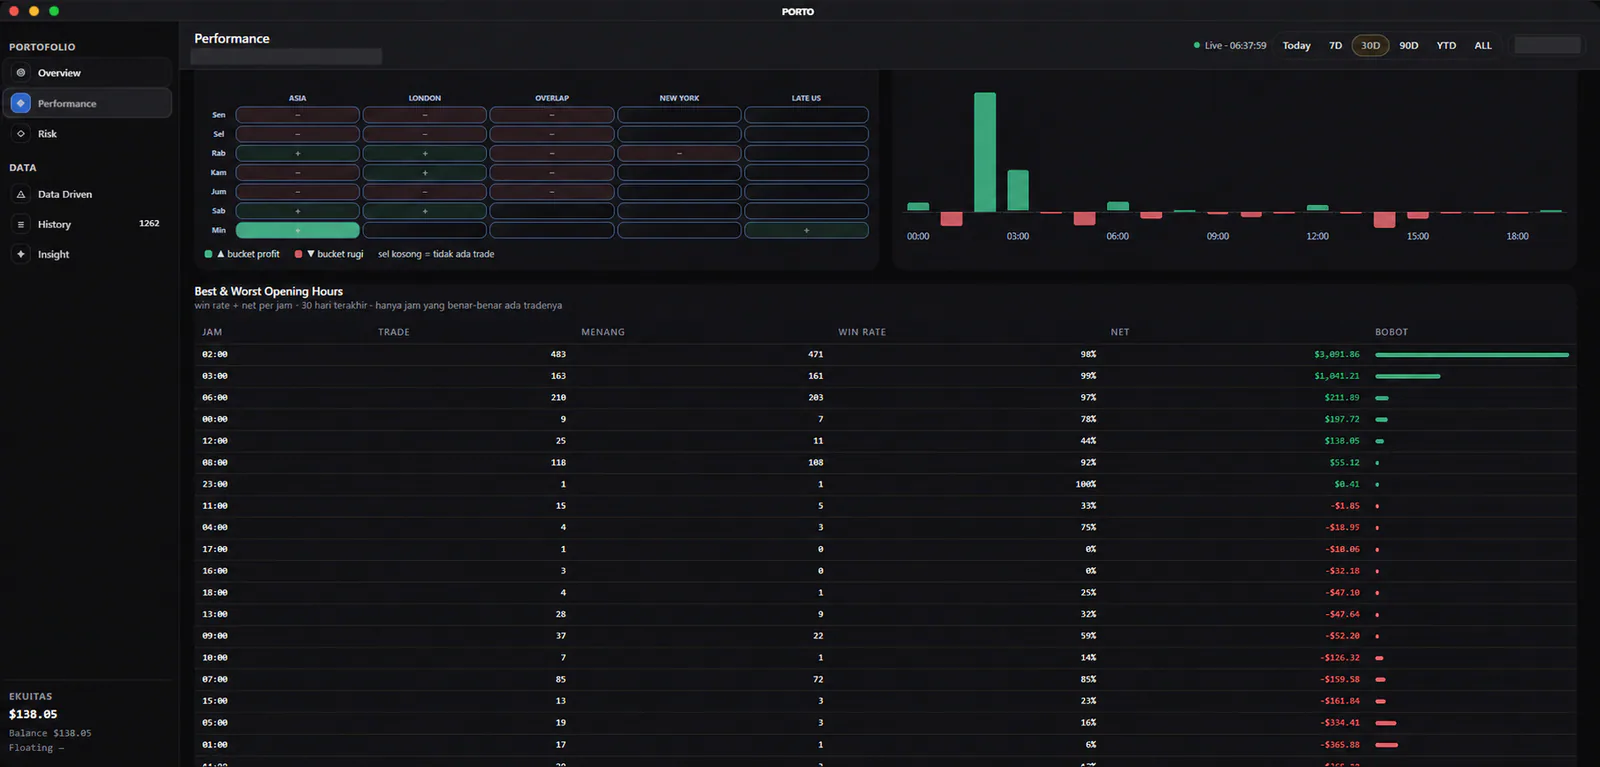 Day × sessionOpening-hour netTrade-count context
Portfolio questions
Know what the evidence can—and cannot—tell you.
Portfolio is a review surface. It adds structure and context without turning historical results into advice or a guarantee.
No. Portfolio organizes historical and selected-period evidence. Past, simulated, or displayed results do not predict future outcomes.
They show privacy-sanitized Portfolio interfaces built from a selected 30-day closed-trade view. Private account, broker, and individual source identifiers have been removed.
The view presents analysis and review context. Account authority, broker execution, configuration, risk limits, and final trading decisions remain with the user.
Kinetic Family workspace